See where your money goes, across every currency
Monthly breakdowns by category, spending trends over time, and recurring charges detected automatically. No budget required, just connect your accounts.
The spending visibility problem
You have a Chase account in the US and a CaixaBank account in Spain. Your spending lives in two apps, two currencies, two mental models. You know roughly what you spend, but you don't have a clear picture.
Most budgeting apps force you to set up a budget before you see anything useful. That's backwards. You shouldn't need to decide how much to spend on groceries before you can see how much you actually spend on groceries.
Borderless Budget shows you your spending the moment you connect your accounts. Category breakdowns, month-over-month trends, recurring charges, all across currencies. No budget required.
What spending analytics includes
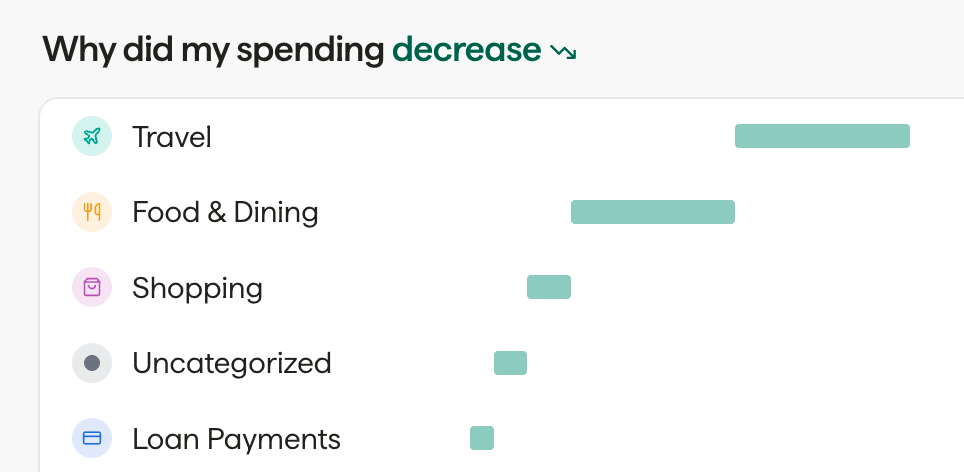
Monthly spending breakdown
See your spending broken down by category for any month. Each category shows a total in your home currency with a breakdown by original currency underneath. Your EUR 180 on dining out in Madrid and $45 at restaurants in New York show up in the same category, with both the converted total and original amounts visible.
Month-over-month trends
For every category, see whether you're spending more or less than last month. A simple percentage change makes it easy to spot when dining out is creeping up or groceries are trending down. All conversions use daily exchange rates, so the trends reflect real spending changes, not exchange rate fluctuations.
Recurring charge detection
Subscriptions and recurring charges are flagged automatically. See everything you're paying on autopilot in one list, across all your accounts and currencies. Spotify in USD, Netflix in EUR, a gym membership in GBP. Know exactly what's going out every month before it hits.
From visibility to control
Most people don't need a budget to start making better decisions. They just need to see what's happening.
See patterns
Spending breakdowns show you where your money actually goes. Not where you think it goes. The difference is usually surprising, dining out tends to be higher than expected, groceries lower.
Spot changes
Month-over-month trends catch gradual shifts before they become problems. If your transport costs jumped 30% this month, you'll see it right away, not three months later when you finally check your bank statement.
Add structure
OptionalWhen it makes sense, set up a budget based on your actual spending. AI recommends amounts for each category based on your history. Adjust anytime, regenerate anytime. The budget sits on top of the analytics you already have.
Analytics that work across currencies
This is where Borderless Budget is different from single-currency trackers. Your spending categories pull in transactions from all your accounts, regardless of currency. The totals and trends are in your home currency so the big picture is always clear.
But the original amounts are always there. Toggle any category or transaction to see what you actually paid in the local currency. EUR 47.50 dinner in Madrid, $18.50 lunch in New York , both show up in "Dining Out" with accurate conversions and original amounts preserved.
Exchange rates update daily, so your month-over-month comparisons reflect real changes in spending behavior, not just currency fluctuations.
Spending analytics questions
Your budget shouldn’t need a passport
See where your money goes across every currency
Join the waitlist for early access. Spending analytics are included on every plan.
No spam, just launch updates.