
Related articles
Track your own money with Borderless Budget
Every account stays in its own currency, and every total adds up in yours. The first 30 days are free.
Get startedA tour of the Spending tab: the sentence at the top, the overview card, the Where it went list with its one By category list and change in words, and the detail sheet, on a computer and on a phone.
Every account stays in its own currency, and every total adds up in yours. The first 30 days are free.
Get startedBorderless Budget's Spending tab answers one question: where did your money go, and what changed?
Under the Spending title, one sentence sums up the period: how much you've spent, how that compares with the period you chose to compare against, and which category (or merchant, or account) took the most. The period stepper beside the title moves back and forward a period at a time; open it to switch between week, month, quarter and year, or to pick custom dates. It sets every figure on the page.
On a phone, Spending sits small at the top with the period stepper beside it, and the sentence becomes the page's headline: what you've spent in large figures, then the rest of the sentence. Tap the period to open Show spending for, where the current choice has a check. Custom dates… opens its own sheet with a start and an end date; Apply stays off until the end date is on or after the start.

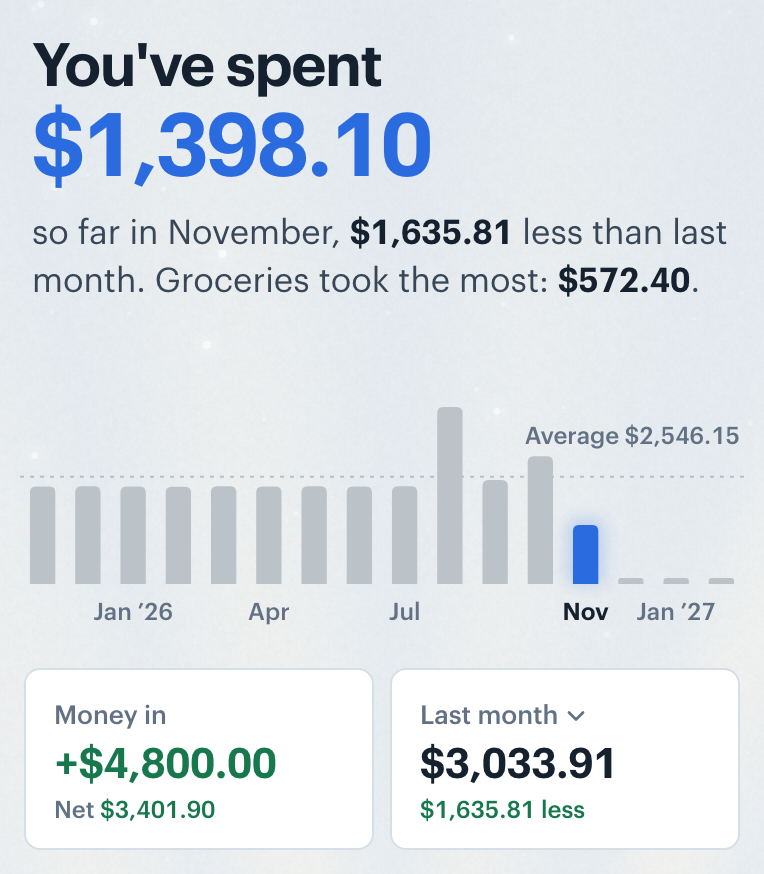
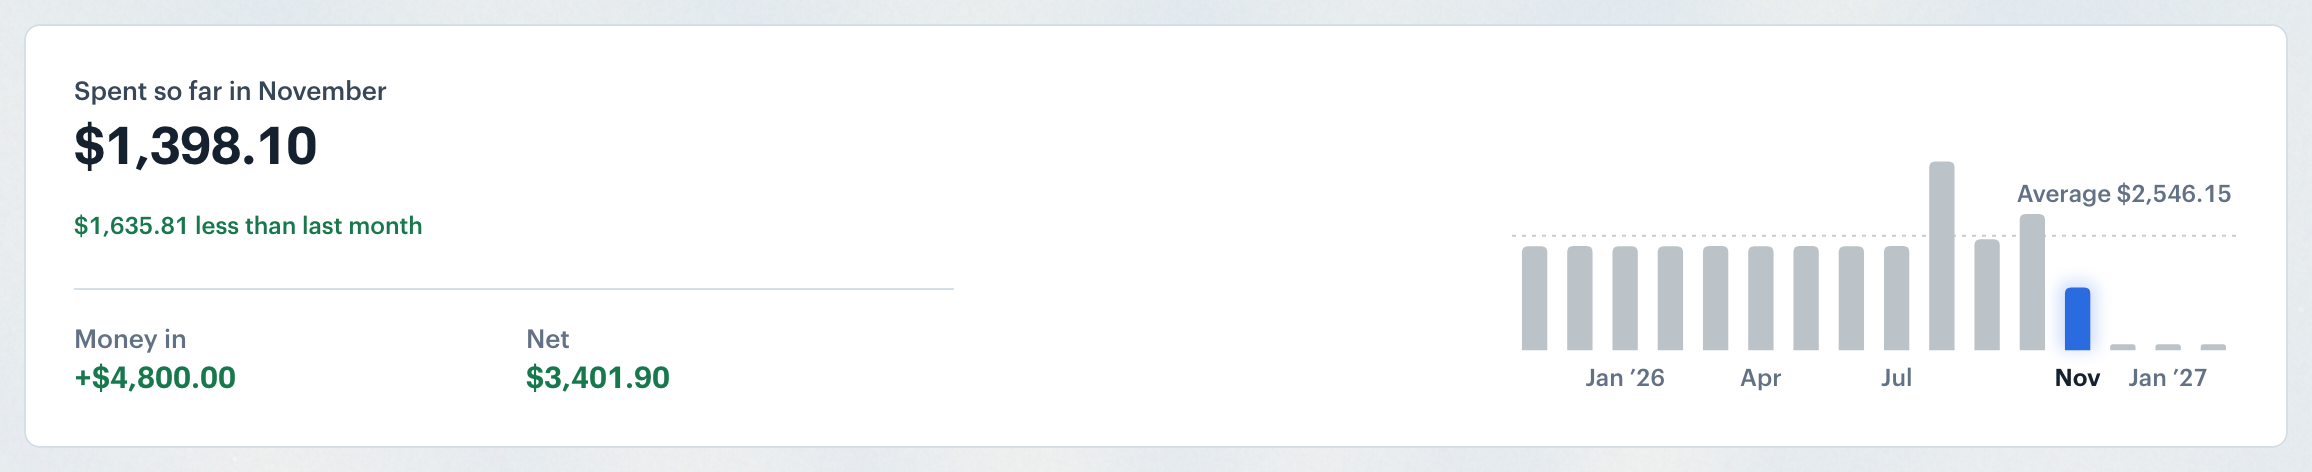
The overview card shows what you spent, a chip that says how that compares ("$45.91 less than last month"), your money in and your net for the period. The bars show every month you have, and scroll sideways when there are more than fit; hover one to preview that month's figures, click it to open that month. A dotted line across the bars marks your monthly average over the last 12 full months, labelled with the amount.
On a phone the bars sit under the headline. Tap a bar to open that month, or press and hold one, then slide, to see each month's spending without leaving the period. Under the bars, the Money in tile shows your net under it, and the second tile shows the comparison total; tap its name to change what you compare against.
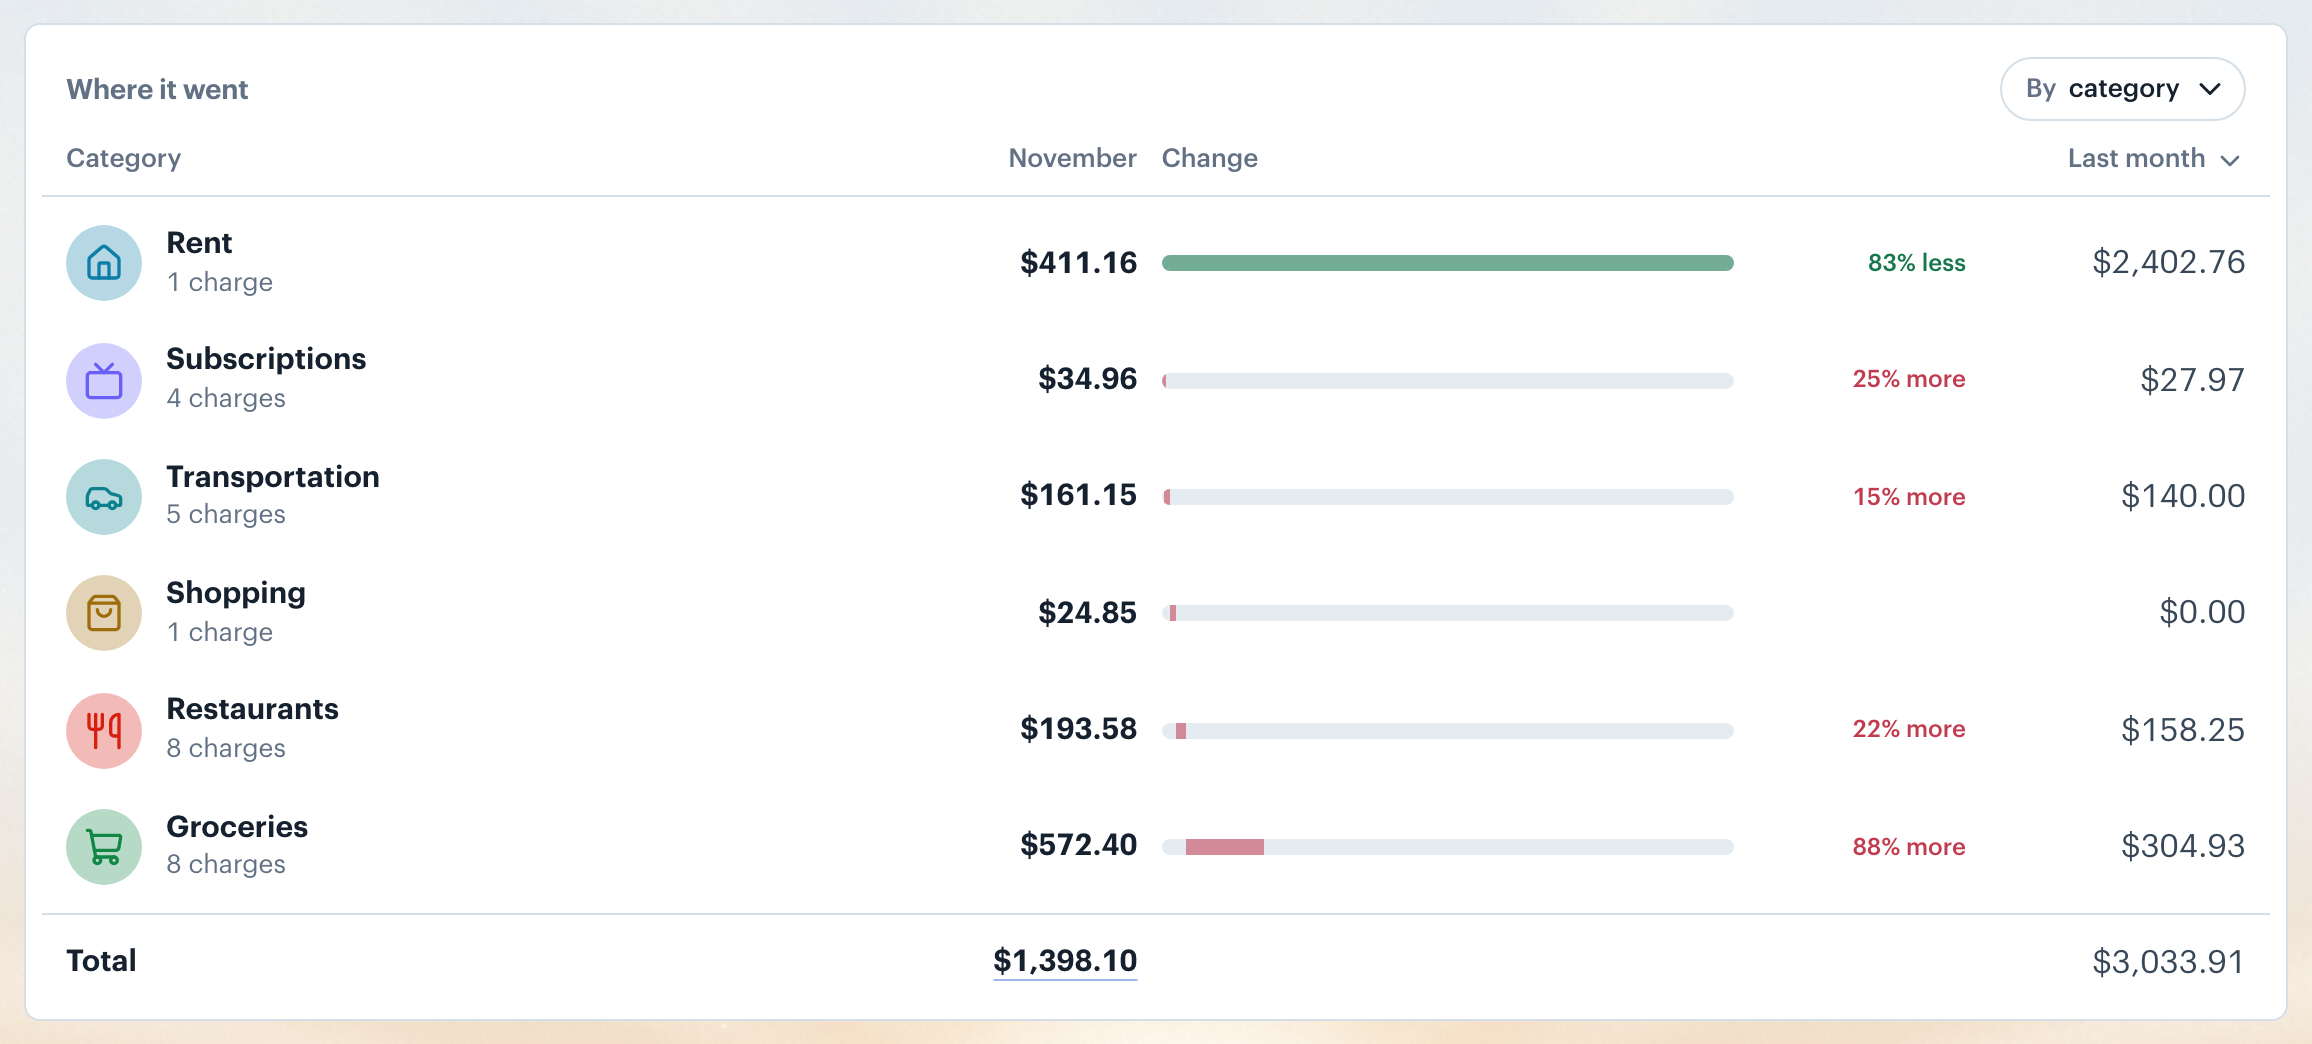
Where it went lists every row for the period, with no limit. The By category button opens one list for the table: Compare to chooses the comparison (last month, your 3-month average or your 12-month average for a month, and the matching choices for other periods), and it also sets the chip in the overview and the sentence at the top; Breakdown switches the rows between Category, Merchant, Account and Recurring; Group by groups rows by category group or category, for every breakdown but Account. The Total at the bottom opens the same period in Transactions.
With a comparison on, rows sort by how much they changed. Each shows a bar that steps from the comparison total toward this period's, and a chip in words: "12% more" in red or "18% less" in green. The last column shows each row's spending in the comparison period; open its menu and choose Difference to see "$92.15 less" instead. A category you spent on last time but not this time still has a row, so the Total always lines up with the sentence at the top.
On a phone, By category opens its list as a sheet titled Where it went. Each row also folds up there: the comparison amount moves under the name, after the number of charges.
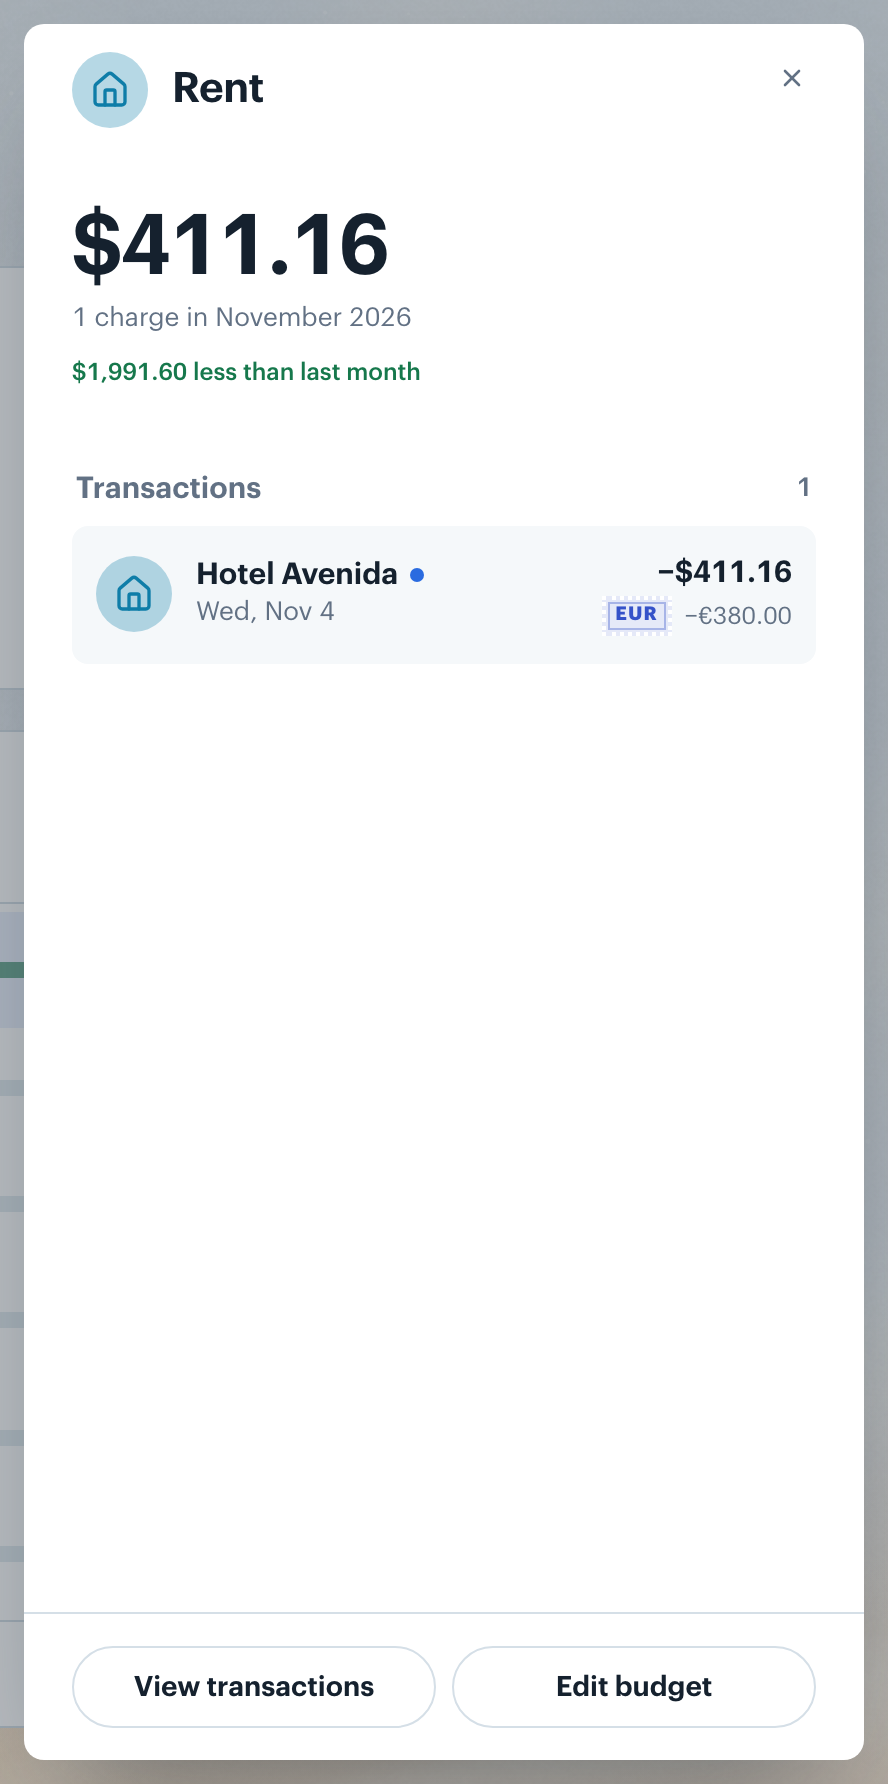
Click any row to open it in a sheet: its name, its total, the number of charges and how it compares, then its transactions, each with its date. From a category you can jump to its transactions with View transactions or to its budget with Edit budget. Press Esc or click outside the sheet to close it.
Want to see all transactions for a category? See Transactions Overview.
👋 Still have questions? Email [email protected].